Delivers Solid Sales and Earnings Growth; Raises 2018 Sales and EPS Guidance
TriMas (NASDAQ: TRS) today announced financial results for the quarter ended September 30, 2018.
Third Quarter 2018 Highlights
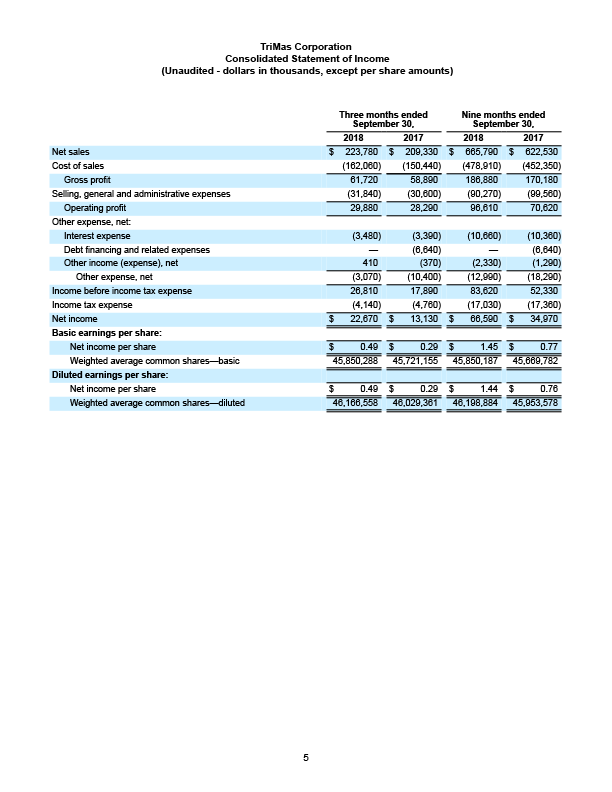
- Increased net sales by 6.9% to $223.8 million
- Increased operating profit to $29.9 million, while adjusted operating profit(1) increased by 4.2% to $30.2 million
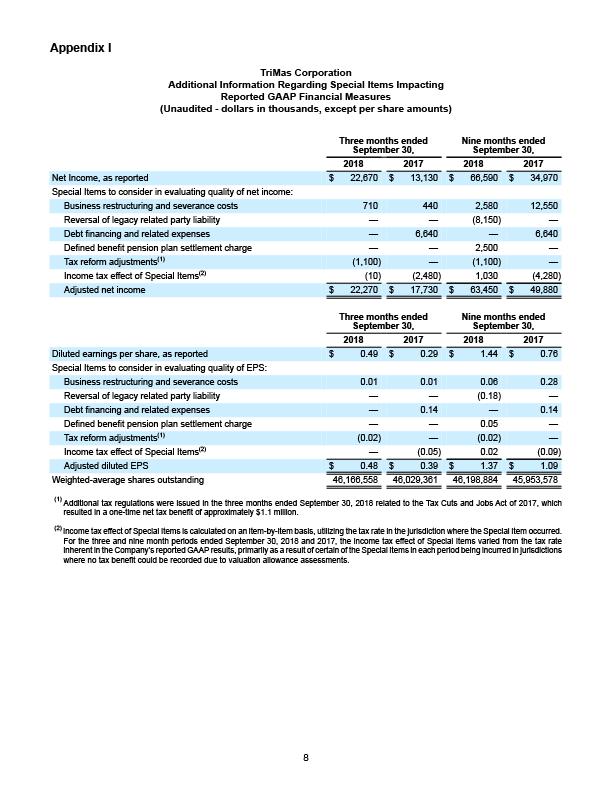
- Increased diluted EPS to $0.49, while adjusted diluted EPS(1) increased by 23.1% to $0.48
- Raised full year 2018 EPS guidance to $1.72 to $1.78, with the new midpoint representing an increase of approximately 25% over 2017
Third Quarter 2018
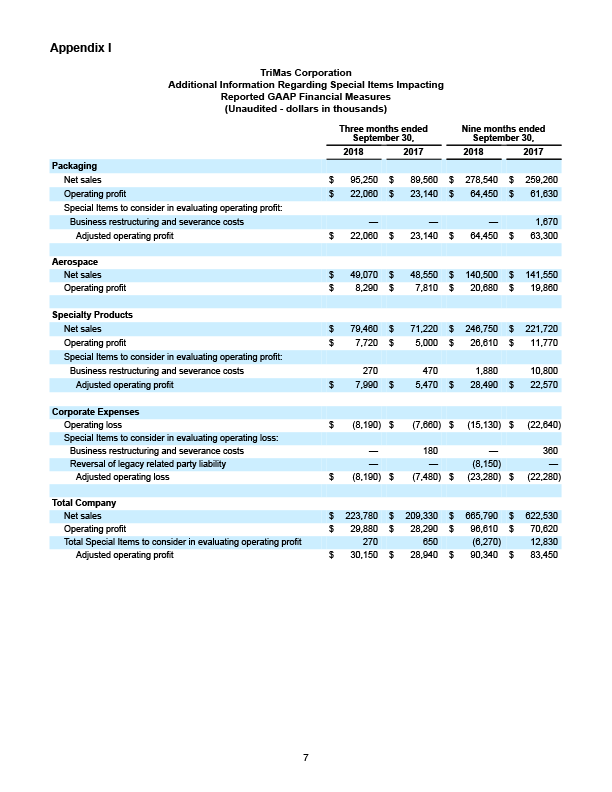
TriMas reported third quarter net sales of $223.8 million, an increase of 6.9% compared to $209.3 million in third quarter 2017. The Company reported operating profit of $29.9 million in third quarter 2018 compared to $28.3 million in third quarter 2017. Adjusting for Special Items(1), third quarter 2018 adjusted operating profit was $30.2 million, an increase of 4.2% compared to the prior year period, as the favorable impact of volume increases was partially offset by higher commodity costs.
The Company reported third quarter 2018 net income of $22.7 million, or $0.49 per diluted share, compared to net income of $13.1 million, or $0.29 per diluted share, in third quarter 2017. Third quarter 2018 adjusted net income(1) was $22.3 million, or $0.48 per diluted share, an increase of 25.6% compared to $17.7 million, or $0.39 per diluted share, in the prior year period.
"We are pleased to report another strong quarter with our global team delivering results ahead of expectations," said Thomas Amato, TriMas President and Chief Executive Officer. "We achieved approximately 7% organic sales and 23% adjusted earnings per share growth compared to the prior year, while generating solid cash flow, further strengthening our balance sheet. We continue to be encouraged by the overall demand environment, and believe our investments in growth initiatives are gaining traction across our businesses."
"During the first nine months of the year, we successfully overcame the impact of higher commodity costs through improved operating performance, incremental volumes and commercial actions, increasing earnings while mitigating much of the pressure on margins. We will continue to aggressively manage these unplanned costs as we move forward throughout the remainder of the year."
"Based on our results to date and current expectations, we are increasing our full year 2018 sales and earnings per share guidance. We will continue to execute our plan by driving the performance of our businesses under the TriMas Business Model, assess opportunities to better position our businesses and TriMas strategically, and drive strong cash flow conversion to further enhance our capital allocation alternatives," Amato concluded.
Financial Position
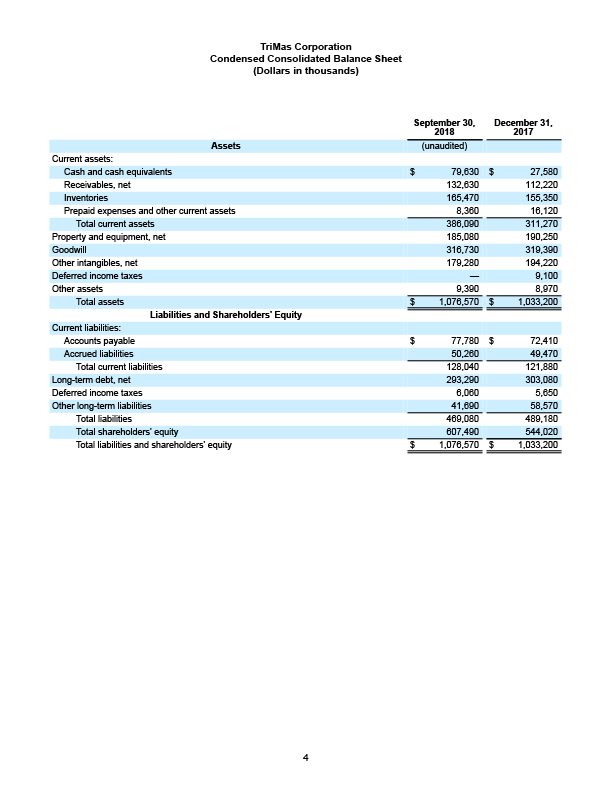
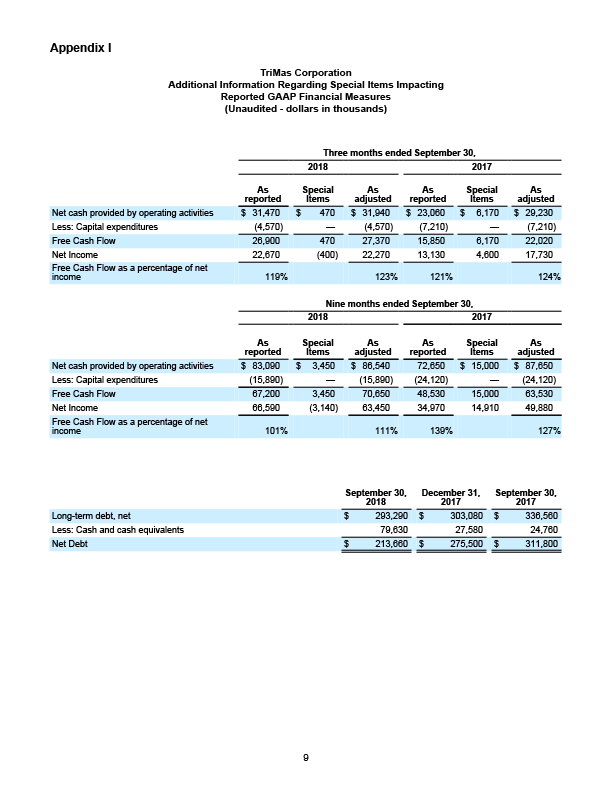
TriMas reported total debt of $293.3 million as of September 30, 2018, compared to $336.6 million as of September 30, 2017, a reduction of $43.3 million. In addition, the Company reduced Net Debt(2) by $98.1 million to $213.7 million, compared to $311.8 million as of September 30, 2017. TriMas ended third quarter 2018 with $79.6 million of cash and $364.5 million of cash and aggregate availability under its revolving credit facility, and a leverage ratio of 1.5x compared to 2.1x as of September 30, 2017, as defined in the Company's credit agreement.
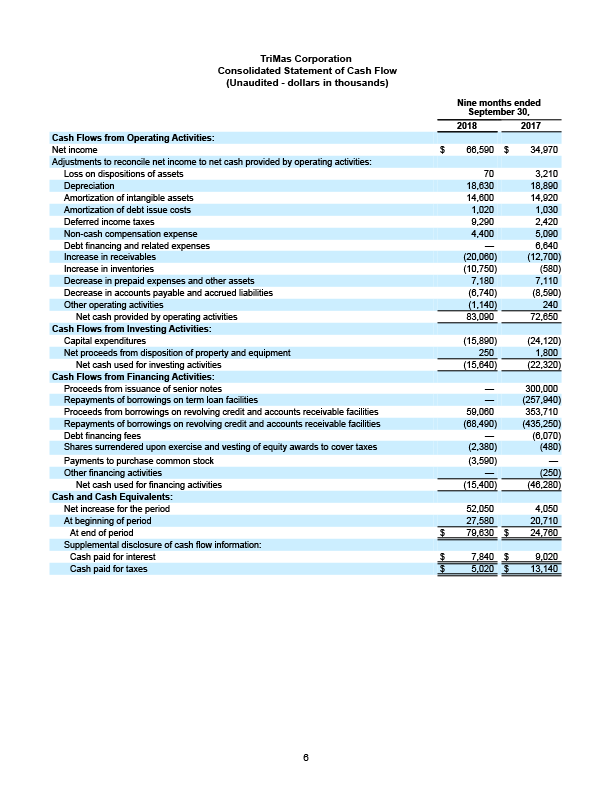
In the three and nine months ended September 30, 2018, the Company purchased 23,191 and 124,138 shares of its outstanding common stock for approximately $0.7 million and $3.6 million, respectively. The Company has approximately $46 million remaining on its November 2015 share buyback authorization as of September 30, 2018.
The Company reported net cash provided by operations of $31.5 million for third quarter 2018 compared to $23.1 million in third quarter 2017. As a result, the Company reported Free Cash Flow(3) of $27.4 million for third quarter 2018, compared to $22.0 million in third quarter 2017. Please see Appendix I for further details.
Third Quarter Segment Results
Packaging (Approximately 42% of TriMas September 30, 2018 LTM sales)
TriMas' Packaging segment, which consists primarily of the Rieke® brand, develops and manufactures specialty dispensing and closure products for the health, beauty and home care, food and beverage, and industrial markets. Net sales for the third quarter increased 6.4% compared to the year ago period, primarily as a result of higher sales of health, beauty and home care, and industrial products, related to new product introductions and continued growth in Asia. Third quarter operating profit and the related margin percentage decreased, as the favorable impact of increased sales levels was more than offset by the impact of higher material costs and a less favorable product sales mix.
Aerospace (Approximately 21% of TriMas September 30, 2018 LTM sales)
TriMas' Aerospace segment, which includes the Monogram Aerospace Fasteners™, Allfast Fastening Systems®, Mac Fasteners™ and Martinic Engineering™ brands, develops, qualifies and manufactures highly-engineered, precision fasteners and machined products to serve the aerospace market. Net sales for the third quarter increased 1.1% compared to the year ago period, as increased demand more than offset the impact of the decision to exit less profitable machined components. Third quarter operating profit and the related margin percentage increased as a result of the impact of continued production efficiencies, higher sales levels and a more favorable product sales mix, which were partially offset by incremental costs and temporary inefficiencies related to negotiating and finalizing a revised collective bargaining agreement, which now extends to 2021, at one of the U.S. plants.
Specialty Products (Approximately 37% of TriMas September 30, 2018 LTM sales)
TriMas' Specialty Products segment, which includes the Norris Cylinder™, Lamons® and Arrow® Engine brands, designs, manufactures and distributes highly-engineered steel cylinders, sealing and fastener products, and wellhead engines and compression systems for use within the industrial, petrochemical, and oil and gas exploration and refining markets. Third quarter net sales increased by 11.6% compared to the year ago period, with higher sales levels of all brands due to refocused commercial efforts and increased end market demand. Third quarter operating profit and the related margin level increased, as the impact of higher sales levels and prior realignment actions offset the impact of higher material costs.
Outlook
The Company raised its full year 2018 sales and earnings per share guidance. The Company increased its 2018 full year organic sales growth estimate to ~6% compared to 2017, from the previous guidance of ~5%. The Company also raised its 2018 full year diluted earnings per share range to $1.72 to $1.78 from the previous range of $1.65 to $1.75, and compared to its previous guidance provided in February 2018 of $1.60 to $1.75. The Company continues to expect 2018 Free Cash Flow(2) to be greater than 120% of net income. All of the above amounts considered as 2018 guidance are after adjusting for any current or future amounts that may be considered Special Items.
Conference Call Information
TriMas will host its third quarter 2018 earnings conference call today, Tuesday, October 30, 2018, at 10 a.m. ET. The call-in number is (877) 260-1479. Participants should request to be connected to the TriMas third quarter 2018 earnings conference call (Confirmation Code #6060513). The conference call will also be simultaneously webcast via TriMas' website at www.trimascorp.com, under the "Investors" section, with an accompanying slide presentation. A replay of the conference call will be available on the TriMas website or by dialing (888) 203-1112 (Replay Passcode #6060513) beginning October 30, 2018 at 3 p.m. ET through November 6, 2018 at 3 p.m. ET.
Notice Regarding Forward-Looking Statements
Any "forward-looking" statements, within the meaning of Section 27A of the Securities Act of 1933 and Section 21E of the Securities Exchange Act of 1934, contained herein, including those relating to the Company’s business, financial condition or future results, involve risks and uncertainties with respect to, including, but not limited to: general economic and currency conditions; material and energy costs; risks and uncertainties associated with intangible assets, including goodwill or other intangible asset impairment charges; competitive factors; future trends; the Company’s ability to realize its business strategies; the Company’s ability to identify attractive acquisition candidates, successfully integrate acquired operations or realize the intended benefits of such acquisitions; the performance of subcontractors and suppliers; supply constraints; market demand; technology factors; intellectual property factors; litigation; government and regulatory actions, including, but not limited to, the impact of tariffs, quotas and surcharges; the Company’s leverage; liabilities imposed by debt instruments; labor disputes; changes to fiscal and tax policies; contingent liabilities relating to acquisition activities; information technology factors; the disruption of operations from catastrophic or extraordinary events, including natural disasters; the potential impact of Brexit; tax considerations relating to the Cequent spin-off; the Company’s future prospects; and other risks that are detailed in the Company's Annual Report on Form 10-K for the fiscal year ended December 31, 2017. These risks and uncertainties may cause actual results to differ materially from those indicated by the forward-looking statements. All forward-looking statements made herein are based on information currently available, and the Company assumes no obligation to update any forward-looking statements.
Non-GAAP Financial Measures
In this release, certain non-GAAP financial measures are used. Reconciliations of these non-GAAP financial measures to the most directly comparable GAAP financial measure may be found in Appendix I at the end of this release. Additional information is available at www.trimascorp.com under the “Investors” section.
- Appendix I details certain costs, expenses and other amounts or charges, collectively described as "Special Items," that are included in the determination of net income, earnings per share and/or cash flows from operating activities under GAAP, but that management believes should be separately considered when evaluating the quality of the Company’s core operating results, given they may not reflect the ongoing activities of the business. Management believes that presenting these non-GAAP financial measures, adjusted to remove the impact of Special Items, provides useful information to investors by helping them identify underlying trends in the Company’s businesses and facilitating comparisons of performance with prior and future periods. These non-GAAP financial measures should be considered in addition to, and not as a replacement for or superior to, the comparable GAAP financial measures.
(2) The Company defines Net Debt as Total Debt less Cash and Cash Equivalents. Please see Appendix I for additional details.
(3) The Company defines Free Cash Flow as Net Cash Provided by/Used for Operating Activities, excluding the cash impact of Special Items, less Capital Expenditures. Please see Appendix I for additional details.
About TriMas
TriMas is a diversified industrial manufacturer of products for customers in the consumer products, aerospace, industrial, petrochemical, refinery and oil & gas end markets with approximately 4,000 dedicated employees in 13 countries. We provide customers with a wide range of innovative and quality product solutions through our market-leading businesses, which operate in three segments: Packaging, Aerospace and Specialty Products. The TriMas family of businesses has strong brand names in the markets served, and operates under a common set of values and strategic priorities under the TriMas Business Model. TriMas is publicly traded on the NASDAQ under the ticker symbol “TRS,” and is headquartered in Bloomfield Hills, Michigan. For more information, please visit www.trimascorp.com.
